

On October 30-31, the Bedrock Web & TV team attended performance.now() 2025 in Amsterdam, one of the few conferences entirely dedicated to web frontend performance. Two intense days of real-world insights, browser deep-dives and discussions about what “fast” truly means in 2025.
⚡ Fast is Pragmagical
Tammy Everts (SpeedCurve)
The conference opened with a simple but essential question: “How fast is fast enough?”
The answer depends on who you are trying to please:
- your boss, who cares about ROI and conversions
- Google, with its Core Web Vitals thresholds
- or your users, who expect instant, seamless experiences
Performance is not just numbers. Fast interfaces remove cognitive friction, keeping users focused and engaged. Tammy described performance as both pragmatic — measurable, business-driven — and magical — the kind of speed that feels effortless.
Core Web Vitals remain a useful baseline, but they are not the finish line. Every product should define its own thresholds based on its users, context and KPIs.
“Fast eliminates cognitive friction, fast is magical. But fast also needs to be pragmatic.”
That balance — pragmagical — became one of the recurring themes of the event.
🧩 Measure What Matters
Harry Roberts (CSS Wizardry), Michal Mocny (Google)
Harry Roberts reminded everyone that performance engineering is not a checklist, but a way of thinking. He emphasized that metrics only matter if they reflect real-world conditions.
Key takeaways:
- Test realistically: replicate actual network conditions, devices and cache states instead of relying on idealized lab setups. Tools like WebPageTest, CrUX and Treo help capture real-world performance data.
- Don’t stop at P75: optimizing for the 75th percentile hides real pain for the rest of your users.
- Focus on enablers: TTFB and DOMContentLoaded unlock good Core Web Vitals.
“The numbers you see represent a huge array of experiences. Test the right thing under the right conditions.”
Michal Mocny then introduced the Soft Navigation API, a long-awaited feature for SPA developers. It enables tracking LCP (Largest Contentful Paint) on soft navigations, not just on the first page load. Combined with INP (Interaction to Next Paint), this finally gives a complete picture of user experience in single-page apps. Still experimental, but already testable in Chrome.
At Bedrock, our Web & TV apps are SPAs and being able to natively measure the user’s navigation experience within the application was something we were sorely lacking. We will quickly experiment with this API and set up monitoring for these metrics.
🕵️ Investigating Performance
Andy Davies (SpeedCurve), Umar Hansa (Independent developer)
While measurement tells you how fast things are, investigation tells you why. Two excellent talks focused on this detective work: Andy Davies on runtime analysis and Umar Hansa on modern DevTools workflows.
LoAF – Making Sense of Long Animation Frames
Andy Davies explored how the browser renders frames, from JavaScript execution to style recalculation, layout, paint and compositing.
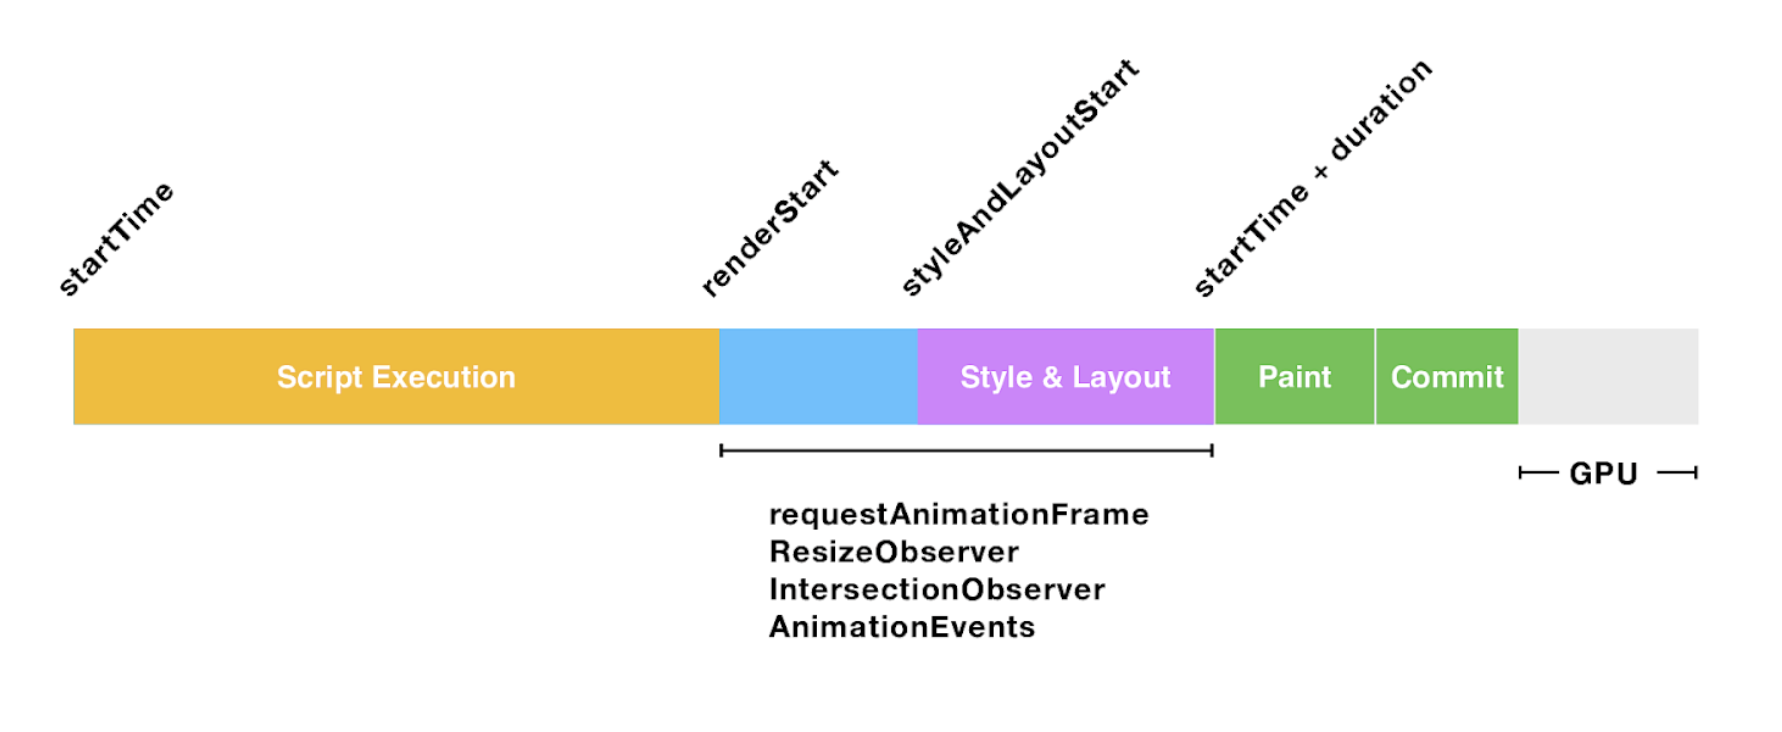
He introduced LoAF (Long Animation Frames), a method to detect frames taking more than 50 ms between start and paint. These “slow frames” often go unnoticed by the Long Tasks API but directly affect smoothness and interactivity.
LoAF provides much richer data than the Long Tasks API, enabling deeper performance analysis:
- Complete script attribution: Each LoAF entry includes a detailed list of scripts that executed during the frame, making it easy for developers to pinpoint the real causes of jank and delayed input. Unlike Long Tasks which only capture task execution, they also include the full rendering pipeline (style, layout, paint), showing scripts that execute during the render phase (mutation observers…).
- Layout thrashing detection: The
forcedStyleAndLayoutDurationproperty reveals when code triggers multiple consecutive forced reflows, a common performance anti-pattern hard to detect in traditional profiling. - Pre-milestone analysis: By filtering LoAF entries, you can identify which scripts run before critical milestones like FCP (First Contentful Paint) or LCP, helping prioritize optimization efforts.
LoAF helps answer key questions:
- Which scripts are blocking the main thread?
- Are long tasks tied to analytics, animations or specific components?
- How do these correlate with INP?
- What’s causing layout thrashing in my app?
Andy released a DevTools extension that makes these insights easy to explore: perf-timeline-to-devtools-profile. For developers looking to implement LoAF monitoring, the webperf-snippets collection provides ready-to-use helpers and the web-vitals.js library includes built-in LoAF support. We are eager to test these tools on our Web & TV apps to find areas for improvement!
Modern Performance Workflows
Umar Hansa shared lesser-known DevTools features that help engineers explore, profile and monitor performance in everyday work. His philosophy was simple: performance should be part of your daily workflow, not a quarterly audit.
Highlights of useful features with Chrome devtools:
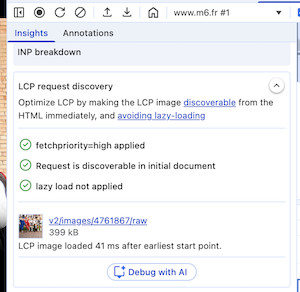
- LCP Request Discovery (in the “Performance” tab) pinpoints the exact resource behind your Largest Contentful Paint
- Lighthouse Timespan runs over a full user flow, perfect for analyzing workflows or transitions
- Recorder Tab captures interactions and replays them, useful to automate custom performance measures. It can also generate Playwright-compatible scripts, ideal for QA engineers. At Bedrock, this could reduce time spent manually documenting reproduction steps for bugs.
- Network overrides allow developers to intercept and modify network responses directly in DevTools, without needing a local proxy. At Bedrock, we often use this feature to streamline debugging or testing API responses without backend changes.
- Per-URL throttling and network priority (only by enabling the Chrome flag
#devtools-individual-request-throttlingin Canary/Dev version) simulate realistic various conditions without global settings

- Annotations in the Performance tab make profiling more collaborative
- Finally, DevTools MCP brings AI assistance directly into debugging. By describing an issue, the AI can compare traces, identify anomalies, generate Lighthouse-style summaries or even produce scripts that can be used in CI pipelines for automated performance monitoring (e.g. based on your git diff) 🤯
Together, these tools turn DevTools into a true performance lab, fast to iterate, easy to share and powered by AI and automation. A new area of play that we will try to address within our teams.
🎨 Rendering Efficiently
Michael Hladky (PushBased), Barry Pollard (Google), Nadia Makarevich (Independent)
Big Data, Zero JS
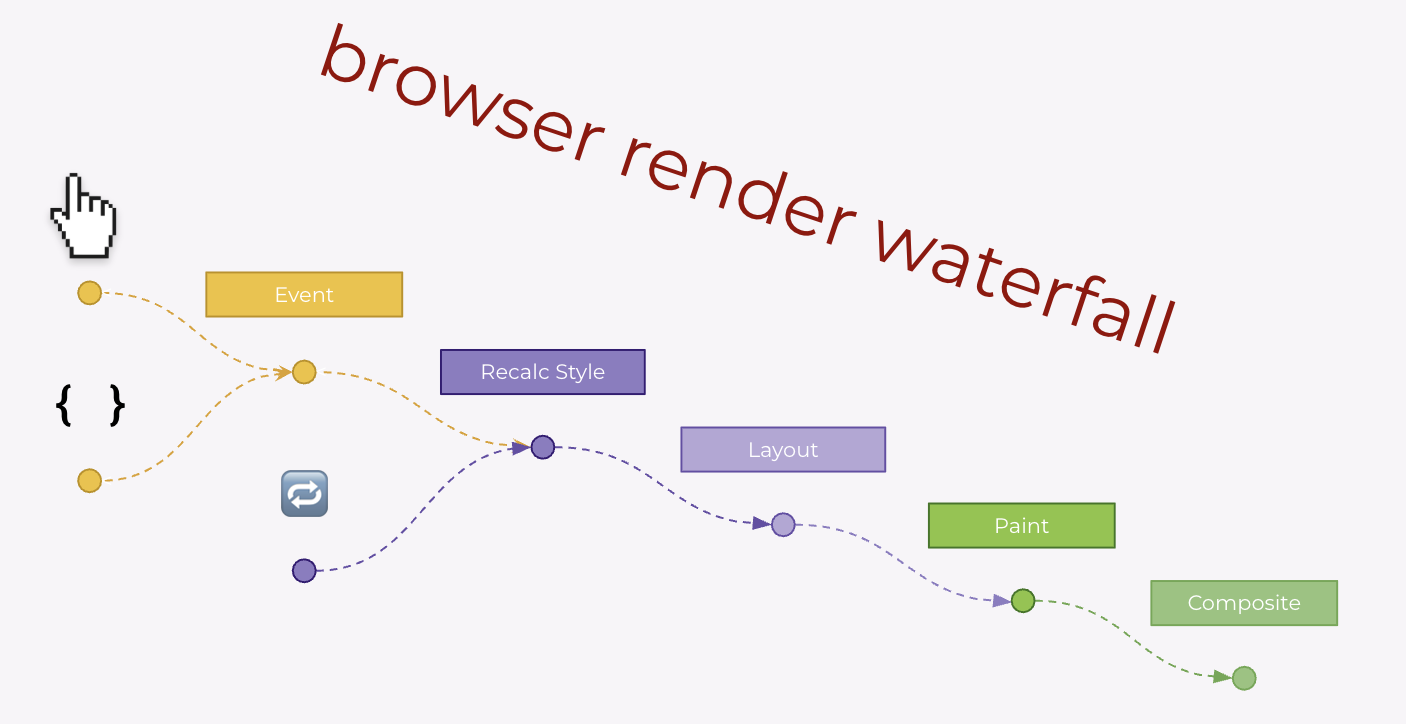
Michael Hladky’s talk focused on optimizing rendering through modern CSS rather than JavaScript. He explained how understanding the browser rendering pipeline — recalculate styles, layout, paint, composite — helps identify where things slow down.
By using new CSS properties like contain (1), content-visibility and contain-intrinsic-size (2), developers can isolate DOM sections and prevent unnecessary reflows or paints.
.card {
  contain: layout;
  content-visibility: auto;
  contain-intrinsic-size: 400px;
}
These properties are now well-supported and can drastically improve performance for large DOM structures like catalogs or carousels. We already use content-visibility and contain-intrinsic-size on few components in our web apps, but we should definitively consider the potential gains from expanding the use of these properties.
For more detail, check CSS Triggers to understand which CSS properties trigger layout or paint.
Speculations about webperf
On the other hand, Barry Pollard introduced the Speculation Rules API, which allows browsers to prefetch or prerender future pages, reducing perceived latency in multi-page apps (MPA). Although caution should be exercised when using it, and although it is currently only available on Chrome (or almost!), it can have a big impact on user navigation, since the next page is prepared in advance.
Companies like Etsy and Shopify have already implemented speculation rules in production and reported significant improvements in perceived performance. While not relevant for Bedrock’s SPA-based apps, it perfectly illustrates a key idea: efficiency is about making users wait less, not just doing less.
React, Rendering & Performance
Finally, Nadia Makarevich compared CSR, SSR and React Server Components using the same React app and metrics to measure their real impact on rendering speed and runtime cost. Her approach was very scientific and interesting.
Key take-aways:
- CSR (Client-Side Rendering): the simplest setup, but all HTML and data are generated client-side, which delays both LCP and hydration
- SSR (Server-Side Rendering): brings immediate LCP improvement by sending pre-rendered HTML, but if user data is fetched on the client, it still causes visible delays and layout shifts
- SSR + Suspense/Streaming: progressively improves Time-to-Display and user perception, as data is streamed and hydrated chunk by chunk
- RSC (React Server Components): theoretically reduces client JS and improves interactivity, but requires major architectural changes; the gains are limited (LCP is the same as “traditional” SSR).
Our web platform uses anonymous SSR (highly cached) and client-side fetches for personalization. Migrating to RSC would require major changes to our architecture, with uncertain short-term gains. We will monitor the technology, but it’s not a priority right now.
🌱 Responsible Performance
Ines Akrap (Green Software Champion)
Ines Akrap’s session Fast, Green, Responsible looked at performance through an ethical and environmental lens. She shared a striking comparison:
80 petabytes of unused JavaScript shipped every month equals 54,000 tons of CO₂, roughly 37 million trees.
But the talk wasn’t just about carbon footprint. It was about user respect. A lighter, more efficient app benefits those on low-end devices or limited networks first. And the web already provides APIs to adapt experiences responsibly:
- user wants fewer or no animation (
prefers-reduced-motion) - user prefers dark or light mode (
prefers-color-scheme) - user has data-saving mode on
- connection speed (
navigator.connection.saveData) - the device is low on power (Battery API)
The principle is simple: a responsible and empathic web is often a faster one. See Web Sustainability Guidelines (W3C) for more details.
🧠 Conclusion: Performance as a Mindset
After two days in Amsterdam, one clear message emerged: performance is no longer just a number… It’s a mindset.
- Technical intent: understanding how browsers work and what causes runtime costs
- Cultural intent: making performance a shared habit across teams
- Responsible intent: optimizing for both users and the planet
“Fast is pragmatic. Fast is magical. And above all, fast is intentional.”