We migrated our first application to a Kubernetes cluster at AWS in 2018 (a colleague even wrote a book about it).
Three years later, we manage a dozen clusters, to which we have added a lot of tools and we have a much better grasp of certain subtleties.
Each cluster reaches, depending on the load, hundreds of nodes and thousands of pods.
Table of Contents
- Base
- Kops and templates
- Tools we use
- Keep tools up to date on all clusters
- Resiliency
- DNS
- Lots of AutoScalingGroups
- Dedicated AutoScalingGroups by app
- QOS Guaranteed Daemonsets
- Scalability
- Cluster Autoscaler
- Expander Priority
- Overprovisioning
- PriorityClass
- Low HPA targets
- Long downscale durations
- Cluster Autoscaler
- Observability
- Metrics
- Logs
- Alerting
- Costs
- Spot instances
- Inter accounts reclaims
- On-demand fallback
- Draino and node-problem-detector
- Spot Tips
- Kube-downscaler
- HAProxy Ingress Controller
- Spot instances
Base
Kops and templates
EKS didn’t exist when we started to work on Kubernetes on AWS. So we use Kops which, by the way, works very well.
Kops creates, updates and deletes our clusters, but also associates resources on our AWS accounts: DNS zone + entries, AutoScalingGroups, SecurityGroups, etc.
Our rolling updates and rolling upgrades are 100% handled by kops which never failed us.
Because we have several clusters, we use kops toolbox template instead of having a single YAML file per cluster. We have mutualized resources definitions, like AutoScalingGroups, DNS options or namespaces list, inside common files and use a dedicated template file per cluster, referencing mutualized configs through variables.
For example, the EC2 instance types will be defined as snippets:
± cat snippets/spot_4x_32Gb_machine_type.yaml:
- c5.4xlarge
- c5d.4xlarge
- c5n.4xlarge
And used inside a generic template file:
± cat templates/3_spot-nodes.yaml.tpl
…
  mixedInstancesPolicy:
    instances:
    { { if eq $index "4x_32Gb" } }
    { { include "spot_4x_32Gb_machine_type.yaml" . | indent 4 } }
    { { end } }
…
Finally, if the cluster requires an ASG with instances size 4x with 32GB RAM on Spot instances:
± cat vars/prod-customer.k8s.foo.bar.yaml
…
spot_nodes:
  4x_32Gb:
    az:
      - eu-west-3a
      - eu-west-3b
      - eu-west-3c
    min: 1
    max: 100
A bash script orchestrates all this. It generates manifest files, creates/updates clusters and checks everything is operating normally.
All of the above lives as files in a git repository, ensuring we’re doing only Infrastructure as Code.
We never make any Infrastructure modification outside of code.
Tools we use
We add some tools to a raw Kubernetes cluster:
- aws-iam-authenticator
- cluster-autoscaler
- cloudwatch-exporter-in-cluster
- cni-metrics-helper
- draino
- elasticsearch-cerebro
- fluentd
- haproxy-ingress-controller
- iam-role-for-serviceaccount
- k8s-spot-termination-handler
- kube-downscaler
- logstash
- loki
- metrics-server
- node-problem-detector
- overprovisioning
- prometheus
- prometheus-dnsmasq-exporter
- prometheus-pushgateway
- statsd-exporter
- statsd-proxy
- victoria-metrics-cluster
Some of those tools stand for compatibility reasons after our cloud migration, so our developers can still use our ELK stack, or a statsd format to generate metrics.
We need all these tools to have a production-ready cluster, so we can provide scaling, resilience, observability, security with controlled costs. This list isn’t even exhaustive.
It evolved a lot over the last two years and will surely evolve a lot in the near future, as both Kubernetes and AWS are moving playgrounds.
Keep tools up to date on all clusters
We use a Jenkins job for that.
We deploy k8s-tools the same way we deploy our apis in the cluster: with bash scripts and a helm chart, dedicated per application.
± tree app/loki/.cloud/
app/loki/.cloud/
├── charts
│   ├── Chart.yaml
│   ├── templates/
│   ├── values.yaml
│   ├── values.customerX.yaml
│   └── values.customerY.yaml
└── jenkins
    ├── builder.sh
    └── deployer.sh
A Jenkins job runs the builder.sh, then the deployer.sh script for every k8s-tool.
builder.sh is run when we need to build our own Docker images.
deployer.sh handles the Helm Chart deployment subtleties.
All apps are first deployed on all our staging clusters, then on prod.
Consistency is maintained over all our clusters through this Jenkins job.
Resiliency
DNS
Like everyone who’s using Kubernetes on production, at some point, we faced an outage due to DNS. It was either UDP failing because of a kernel race condition, or musl (Alpine Linux’s replacement of glibc) not correctly handling domain or search, or also the default ndots 5 dnsConfig, or even KubeDNS not handling peak loads properly.
As of today:
- We are using a local DNS cache on each worker node, with dnsmasq,
- We use Fully Qualified Domain Names (trailing dot on curl calls) as much as possible,
- We’ve defined dnsConfig preferences for all our applications,
- We use CoreDNS with autoscaling as a replacement for KubeDNS,
- We forbid as much as possible musl/Alpine
Example of a dns configuration in prod:
  dnsConfig:
    options:
    - name: use-vc
    - name: single-request
    - name: single-request-reopen
    - name: ndots
      value: "1"
  dnsPolicy: ClusterFirst
dnsPolicy: ClusterFirst makes sure we’re using the node’s loopback interface, so pods will send their DNS requests to dnsmasq installed locally on each node.
Dnsmasq forwards DNS queries to CoreDNS for cluster.local. sub-domains and to the VPC’s DNS server for the rest.
Lots of AutoScalingGroups
We had a dozen AutoScalingGroups per cluster.
This was both for resiliency and because we use Spot instances.
With Spot instance reclaims, we needed to have a lot of instance types and family types: m5.4xlarge, c5.4xlarge, m5n.8xlarge, etc.
This is an autoscaler recommendation to split AutoScalingGroups so that each ASG has the same amount of RAM and number of CPU cores when using mixed instances policies.
As a result, we had ASGs like:
- spot_4x_32Gb
- spot_4x_64Gb
- spot_4x_128Gb
Lots of AutoScalingGroups doesn’t work well
AZ rebalancing doesn’t work anymore when using more than one ASG. It becomes totally unpredictable and uncontrollable. It is even a total nightmare with a dozen ASGs.
You can see the difference of outgoing traffic between our 3 NAT Gateway over 4 hours time range :
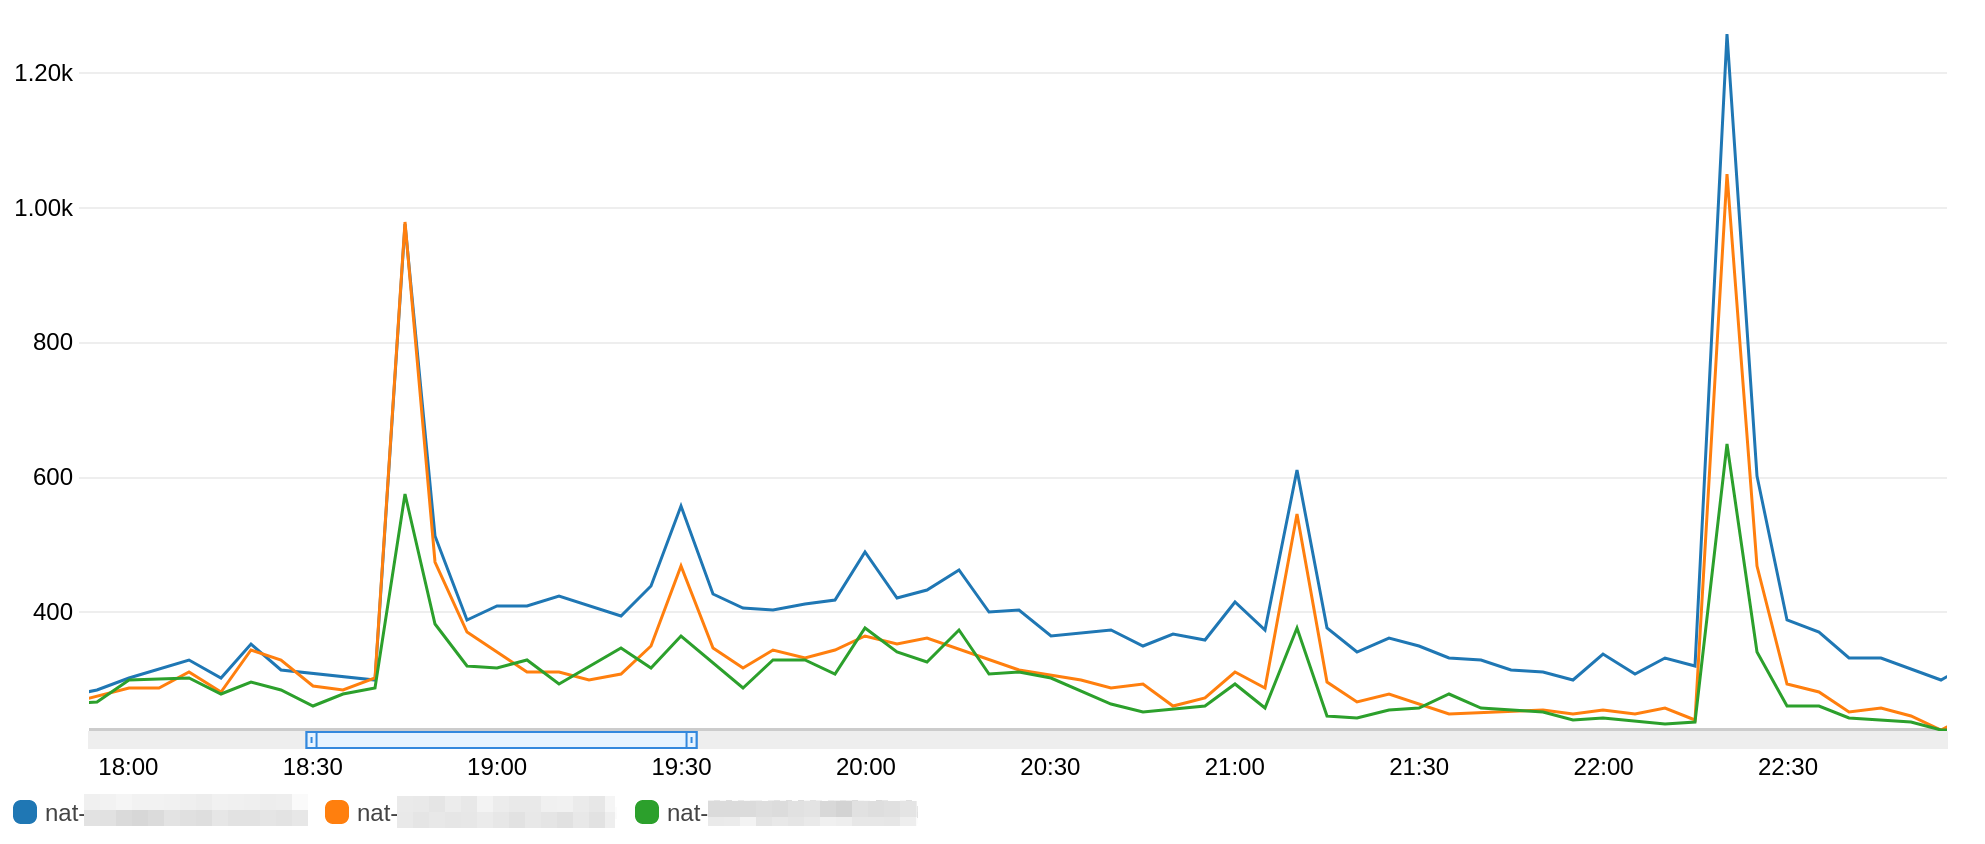 The blue NAT gateway is used way more than the two others between 19h00 and 22h00. The green NAT gateway is used half as much as the other two during peak usage times.
This is because AZ-rebalacing has resulted in twice as many instances in one AZ than in the others.
Also, Kubernetes’s cluster-autoscaler isn’t really compatible with many AutoScalingGroups. We’ll cover how it works later in this post (Scalability/ExpanderPriority), but keep in mind that each application should run on no more than a maximum of 4 ASGs. This is due to the failover mechanism of cluster-autoscaler that doesn’t detect ASGs errors like InsufficientInstanceCapacity, which considerably increases the scale-up time. We are particularly concerned because we need to scale quickly and intensely.
We’ve rolled-back on the ASG number. We now have a maximum of 4 ASGs per application group (see next section: Resiliency/DedicatedAutoScalingGroups), with 2 being Spot and 2 on-demand fallbacks.
For this reason, we no longer respect the recommendation to split AutoScalingGroups so that each ASG has the same amount of RAM and number of CPU cores, in order to reduce ASGs number.
Running PHP, the CPU is our bottleneck, not RAM. So we made the choice to have mixed ASG with the same number of CPUs, but not the same amount of RAM.
This means that our ASG spot-nodes-8x is composed of m5.8xlarge as well as r5.8xlarge
Dedicated AutoScalingGroups by app
We started to dedicate AutoScalingGroups for some applications when Prometheus was eating all the memory of a node, ending up in OOM errors. Because Prometheus replays its WAL at startup and consumes a lot of memory doing so, adding a Limit over the memory was of no use. It was OOMKill during the WAL process, restarted, OOMKilled again, etc. . Therefore, we isolated Prometheus on nodes having a lot of memory so it could use up all of it.
Then, one of our main API experienced a huge load, 60% IDLE CPU to 0% in a few seconds. Because of the brutality of such a peak, active pods started to consume all CPU available on nodes, depriving other pods. Getting rid of CPU limits is a recommendation that comes with drawbacks that we measured and chose to follow the recommendation to ensure performance. As a result, the entire cluster went down, lacking for available CPU. Airbnb shared the same experience: they removed CPU limits because of throttling, but the noisy neighbors forced them to re-introduce limits.
We tried to isolate this API on its own nodes, as such peaks can repeat in the future, because it’s uncacheable and userfacing. We added Taints on dedicated nodes and Tolerations on the selected API.
Since then, we had to deploy a dedicated overprovisioning on those nodes as the overprovisioning pods didn’t have this Toleration. It turned out we’re also able to adapt the overprovisioning specifically for this API, which wasn’t the base idea, but it has proven to be very effective due to the API’s nature. We talk more about overprovisioning’s conf a little later on (Scalability/Overprovisioning).
Now, we’re setting CPU limits, at least for all applications not using dedicated nodes and also because we’ve updated our kernels to the patched version. We follow their CPU usage through Prometheus alerting, with:
- labels:
    severity: notice
    cluster_name: "{ { $externalLabels.cluster_name } }"
  annotations:
    alertmessage: '{ { $labels.namespace } }/{ { $labels.pod } }/{ { $labels.container } } : { { printf "%0.0f" $value } }%'
    description: Container using more CPU than expected.
      It will soon be throttled, which has a negative impact on performances.
    summary: "{ { $externalLabels.cluster_name } } - Notice - K8S - Container using 90% CPU Limit"
  alert: Notice - K8S - Container getting close to its CPU Limit
  expr: |
    (
      sum(rate(container_cpu_usage_seconds_total{job="kubelet", container!="POD", container!=""}[1m])) by (container, namespace, pod)
    / sum(kube_pod_container_resource_limits_cpu_cores{job="kube-state-metrics", container!="POD", container!=""}) by (container, namespace, pod)
    ) * 100 > 90
We don’t currently have alerting on Throttling, only a Grafana graph using the metric:
sum by (pod) (rate(container_cpu_cfs_throttled_seconds_total{job="kubelet", image!="",container!="POD"}[1m]))After Prometheus, we later isolated Victoria Metrics and Grafana Loki on their own ASGs.
We’re also isolating “admin” tools, like CoreDNS, cluster-autoscaler, HAProxy Ingress Controller, on dedicated “admin nodes” group. That way, admin tools can’t mess with applications pods and vice versa.
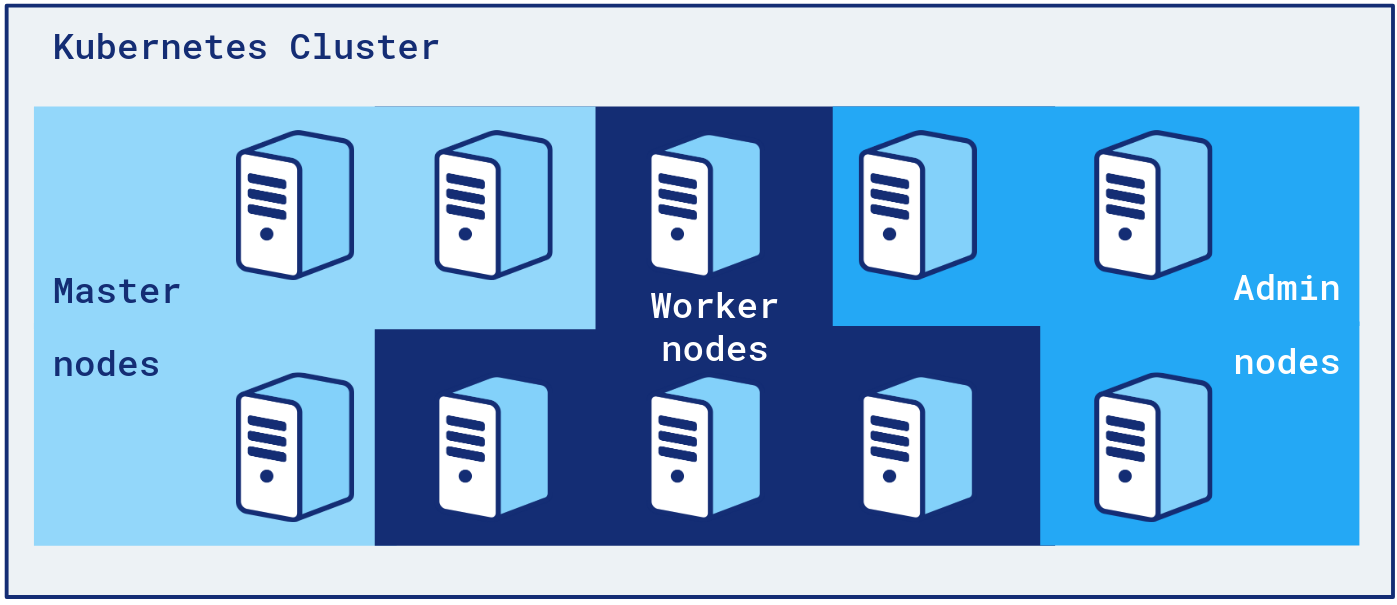 Developers only deploy to Worker nodes. An application’s pods can only be scheduled on 4 ASGs, including 2 on-demand backups.
Our admin nodes are on-demand. Having an ASG of few nodes all Spot is a risk we didn’t want to take regarding the criticality of those pods.
QOS Guaranteed Daemonsets
All our Daemonsets have Requests and Limits set at the same value.
We’ve found out that a lot of Daemonsets don’t define those values by default.
Enforcing QOS Guaranteed Daemonsets:
- ensures our daemonsets request all the resources they need, which is also important for the k8s scheduler to be more effective
- daemonsets bad behaviours can be contained through
Limits, and will not mess up with pods - it’s a good indicator of the overhead we add on each node and helps us choose our EC2 instance types better (E.g: 2x.large instances are too small)
- it’s a reminder that a server with 16 CPUs has in fact only 80% of them usable by application pods
Scalability
Cluster Autoscaler
We automatically scale our EC2 Instances with cluster-autoscaler.
As mentioned before, we have several AutoScalingGroups per cluster.
We use the service discovery feature of cluster-autoscaler to find all ASGs to work with and to control them automatically.
This is done in two steps:
- We add 2 tags on ASGs that the cluster-autoscaler should manage
k8s.io/cluster-autoscaler/enabled: "true"
k8s.io/cluster-autoscaler/{ { $cluster.name } }: "true"
- Then, inside the Chart, we add those two labels to the node-group-auto-discovery parameter:
command:
- ./cluster-autoscaler
- --cloud-provider=aws
- --node-group-auto-discovery=asg:tag=k8s.io/cluster-autoscaler/enabled,k8s.io/cluster-autoscaler/{ { index .Values.nodes .Values.env "clusterName" } }
…
Expander Priority
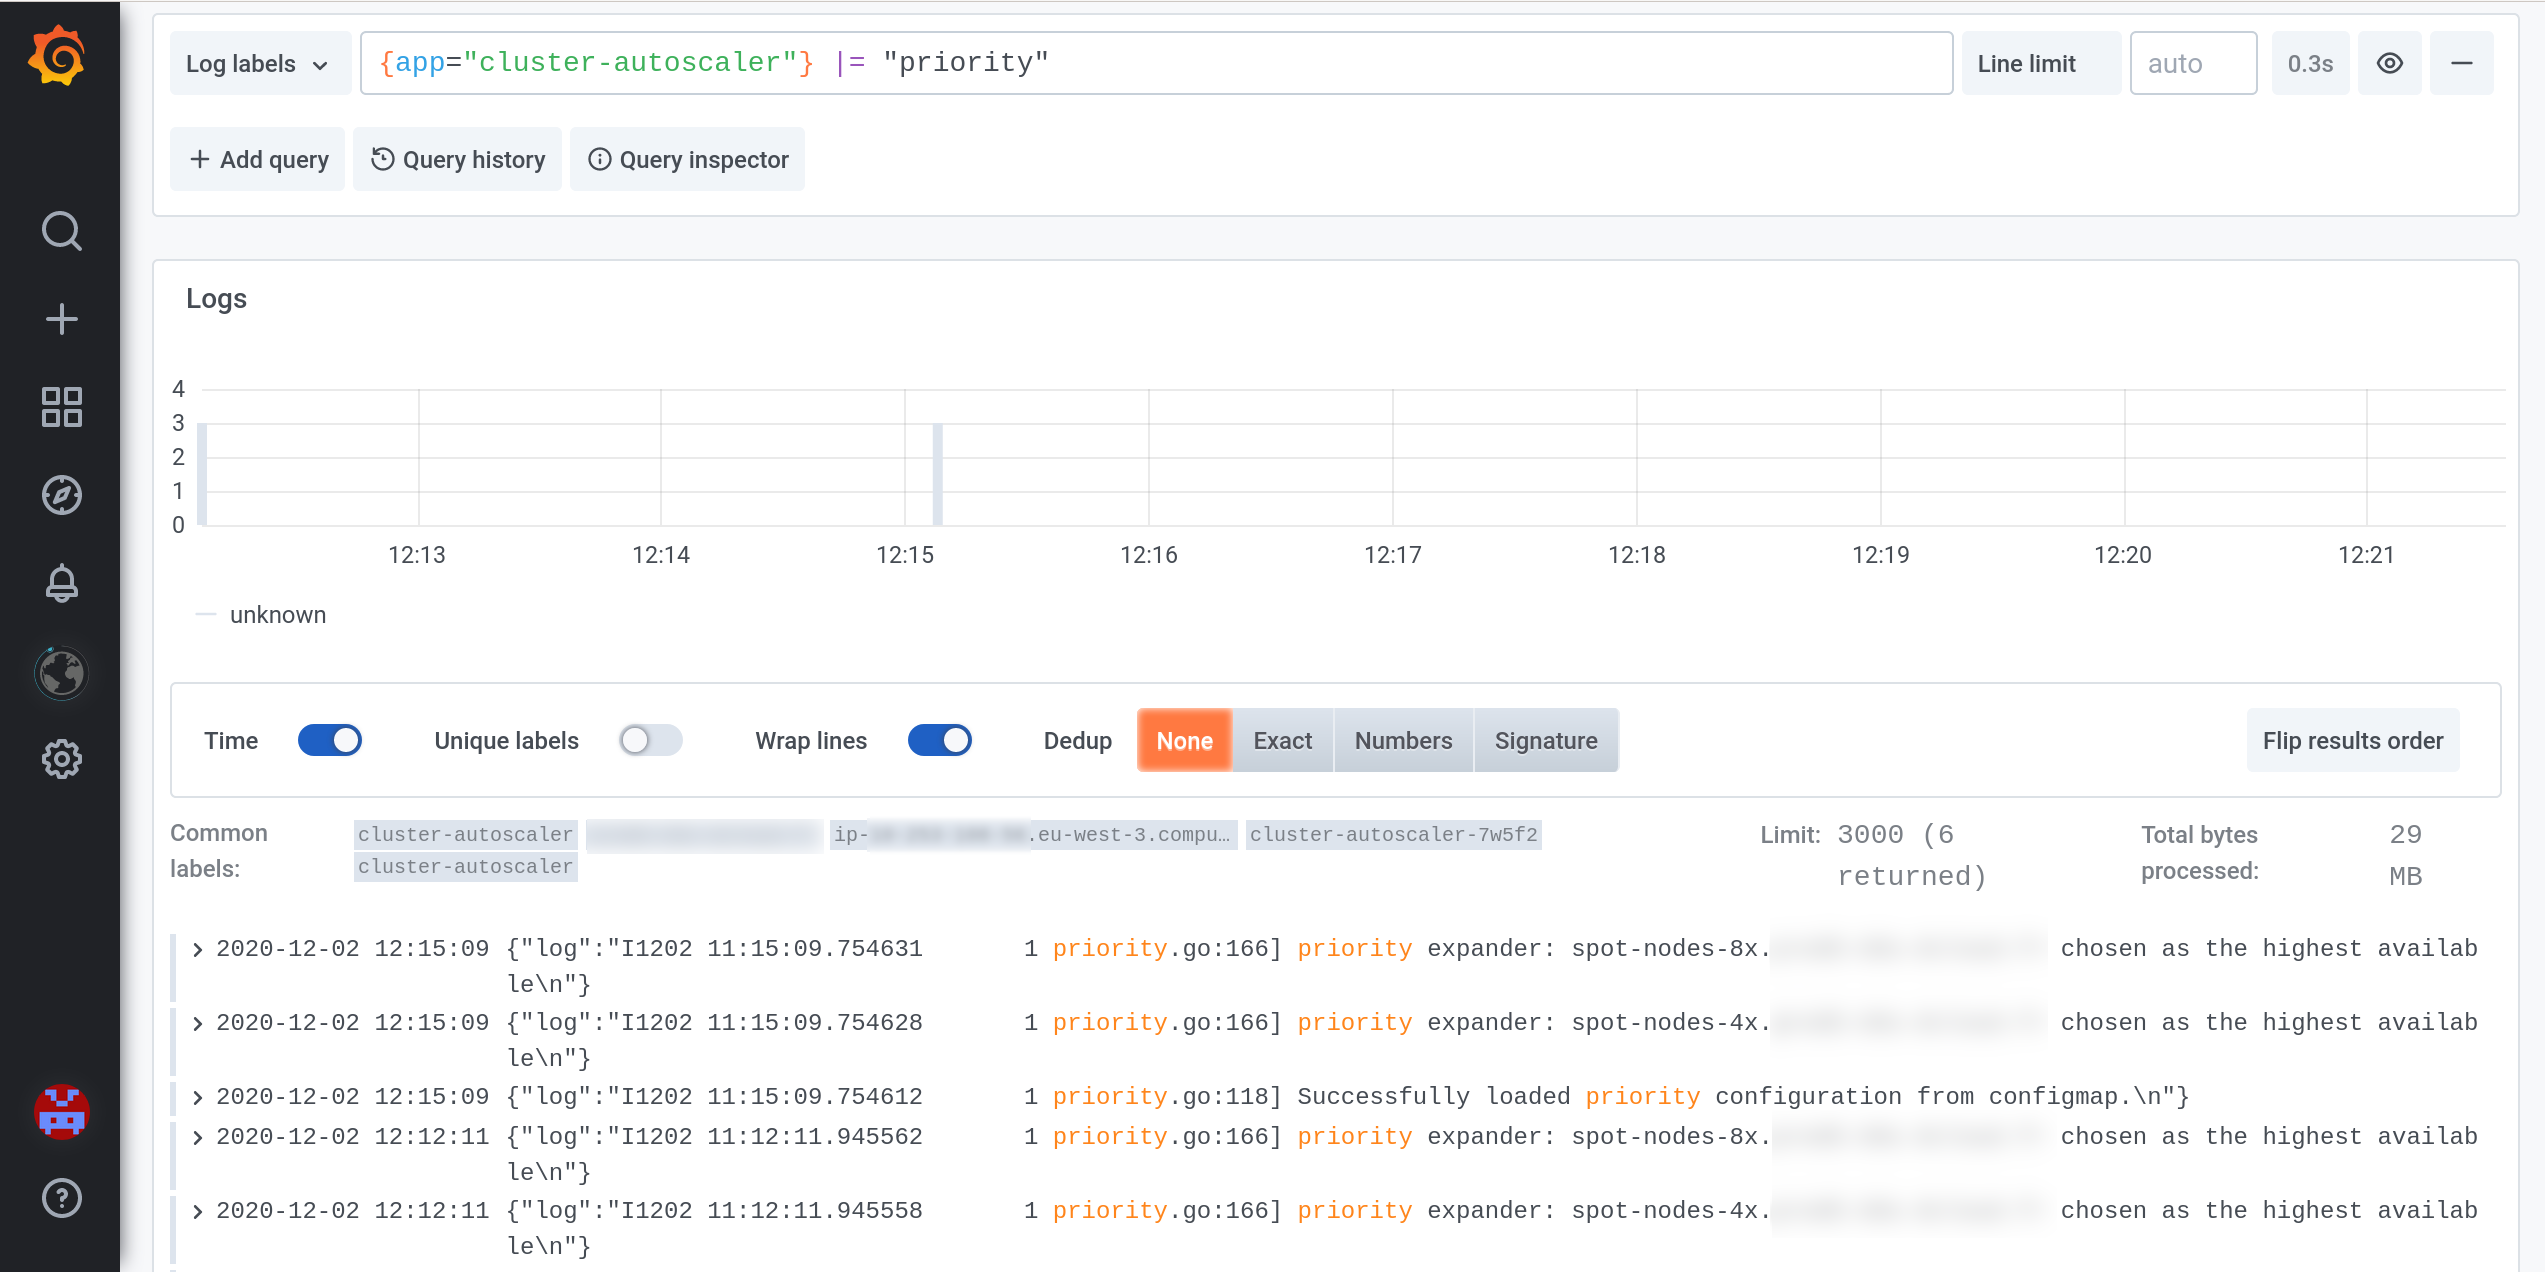
We use cluster-autoscaler with the expander: priority.
ASGs will be chosen as:
spot-nodes-.*on-demand-.*
Cluster-autoscaler will randomly add an EC2 instance in an ASG in the first group: spot-nodes-*. If a new instance hasn’t joined the cluster after the fallback timeout (--max-node-provision-time), it will try another ASG in the same group. It will try all the ASGs in this group before moving on to the next group: on-demand-*.
With a dozen ASGs, most of them being Spot, we’ve already waited for 45 minutes to actually be able to successfully add an EC2 instance.
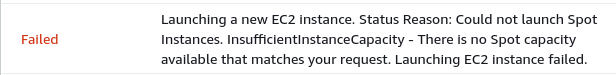
Launching an EC2 instance sometimes fails with InsufficientInstanceCapacity, especially for Spot instances. With the autoscaler recommendation to split ASGs by the same amount of CPU/RAM, there were just too many ASGs to try before falling back on-demand. We’ve reduced the cluster-autoscaler fallback timeout to 5 minutes and still are facing many scaling problems at Paris, where it seems there are not many Spot instances available.
Expander priority allows us to have resilience through an automatic fall back to on-demand when there is no more Spot.
We have already faced, multiple times, a fallback to on-demand instances even with a dozen different instance types. InsufficientInstanceCapacity errors are not a myth. Even on-demand instances can be in InsufficientInstanceCapacity, which we hope to never face with expander priority, 10+ Spot instance types, 10+ on-demand instance types and low --max-node-provision-time.
Overprovisioning
We have overprovisioning pods inside the cluster.
The objective is to trigger a node scale-up before a legitimate pod actually needs resources. Doing so, the pod doesn’t wait minutes to be scheduled, but a few seconds. This need for speed is linked to our business and sometimes the television audience bringing us many viewers very quickly.
This works using overprovisioning pods which request resources without doing anything (docker image: k8s.gcr.io/pause). Those pods are also using a low PriorityClass (-10), lower than our apps.
This trick is the whole magic of this overprovisioning: we request space that can be reclaimed anytime and very quickly. When an app needs it, the Scheduler will free up this space by expelling overprovisioning pods (of lower priority) because the cluster doesn’t have enough free space. The expelled pods then change their state to Pending with the Reason: Unschedulable because we just filled the cluster with higher priority pods from the app. Presence of Pending Pods with Unschedulable reason trigger the cluster-autoscaler to add nodes.
We follow the efficiency of this overprovisioning with these Prometheus expressions:
kube_deployment_status_replicas_unavailable: we know which pods are waiting to be scheduled,sum(kube_node_status_condition{condition="Ready",status="false"}): we know if there are UnReady nodes, like when nodes are scaling-up and new nodes don’t have their daemonsets Ready.
Because we have some nice load peaks on our applications, we are using the ladder mode of the overprovisioning. That ensures that we always have a minimum amount of overprovisioning running in the cluster, so we’re able to handle huge loads at any time. Also, we ensure that we don’t waste too much resources when heavily loaded, so we don’t reserve 200 nodes in a cluster of 1000 nodes for example.
The configmap looks like:
data:
  ladder: '{"coresToReplicas":[[16,4],[100,10],[200,20]]}'
We chose to have big overprovisioning pods, bigger than any other pod in the cluster, to ensure that expelling one of the overprovisioning pods is enough to schedule any Pending pod.
PriorityClass
We sacrifice some applications when overprovisioning is not enough.
The overprovisioning magic is based on PriorityClass objects.
We’re using the same logic for our other applications, using PriorityClass.
We have 3 of them which concern applications:
- low: -5
- default: 0
- high: 5
Critical applications are using the “high” PriorityClass.
Most applications are using the “default” one, so they don’t even have to explicitly use it.
Workers doing asynchronous tasks can be cut off for several tens of minutes without any business impact. These are the ones with the “low” PriorityClass we sacrifice when needed.
Here is an example, during a heavy load :
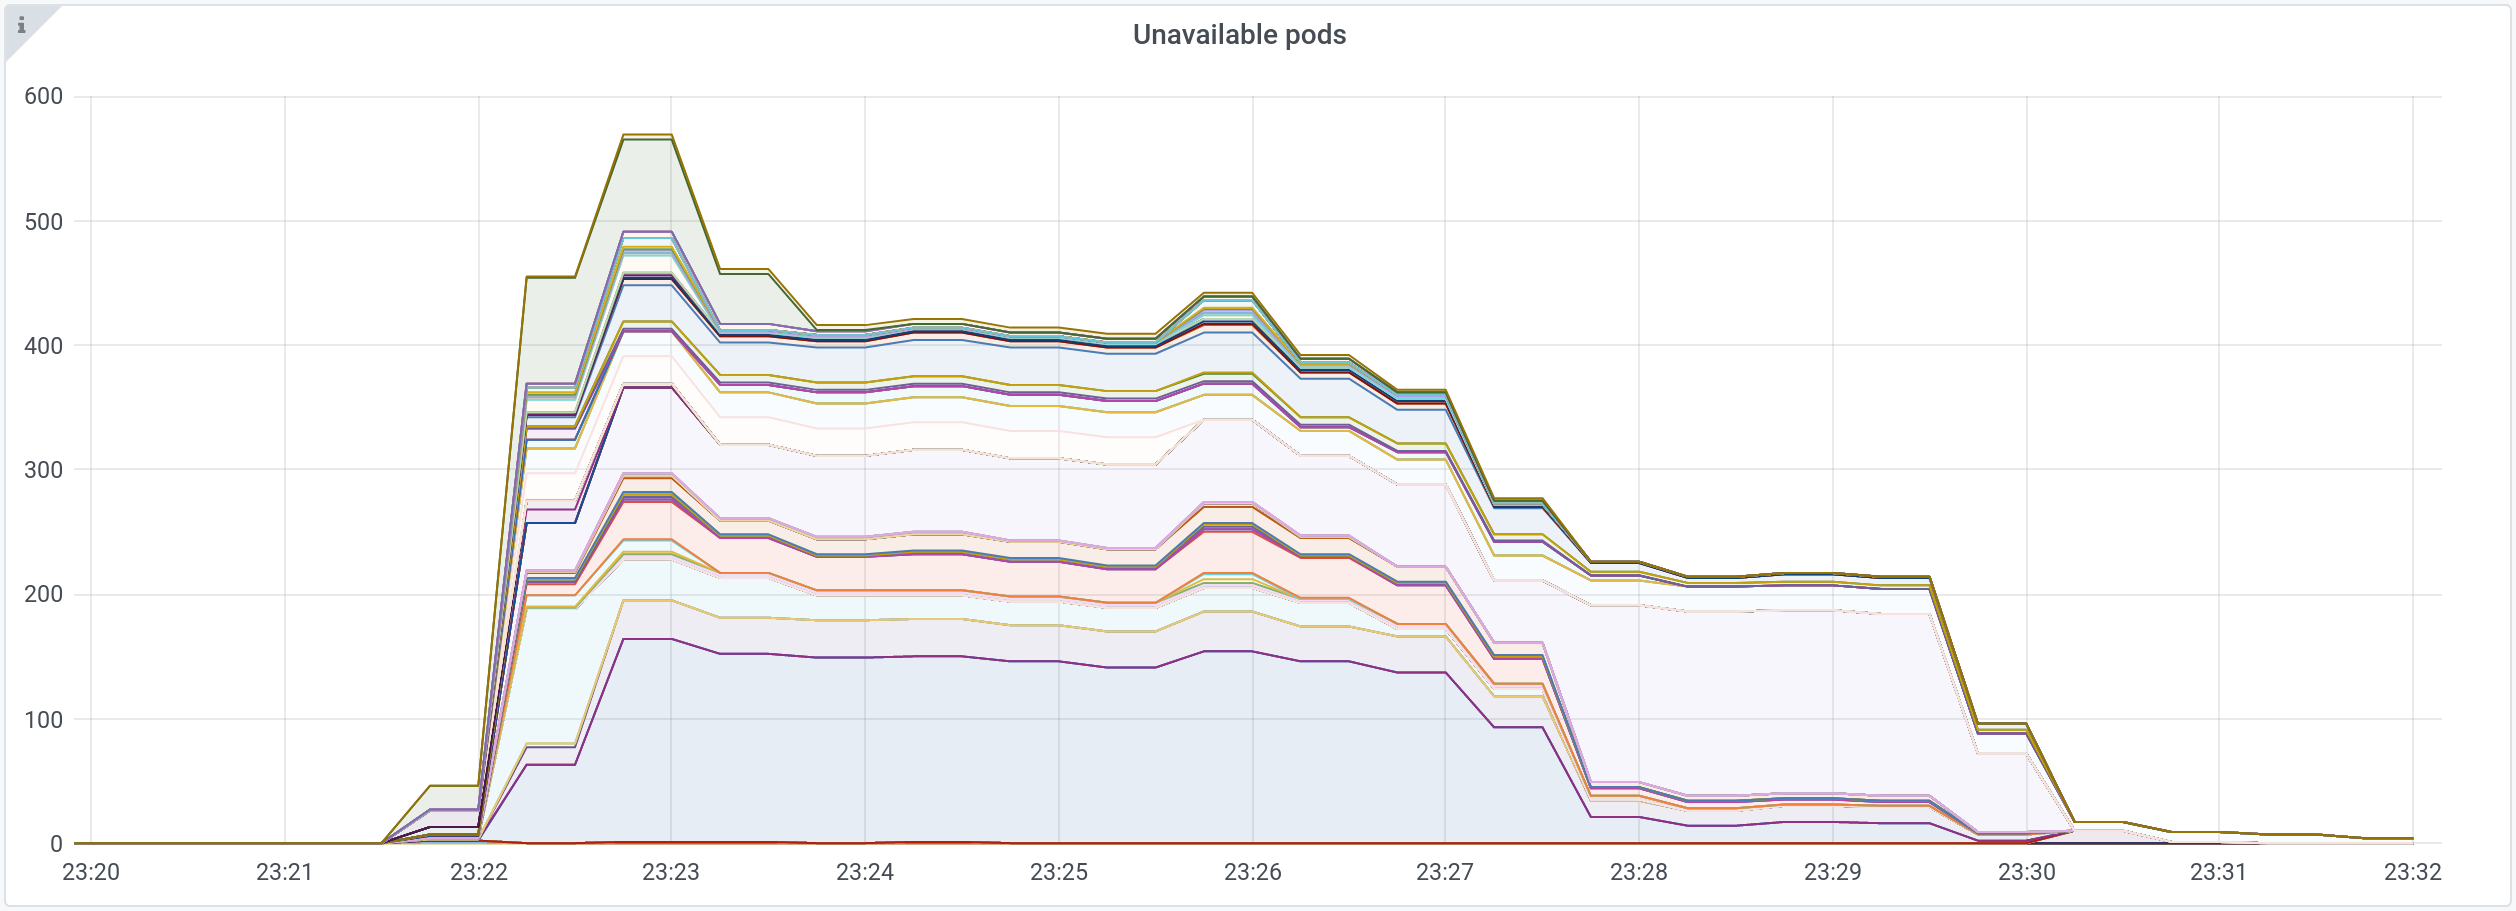 Hundreds of unavailable pods for 10 minutes.
If we filter out “low” PriorityClass pods in the graph above, there’s only one application having unavailable pods:
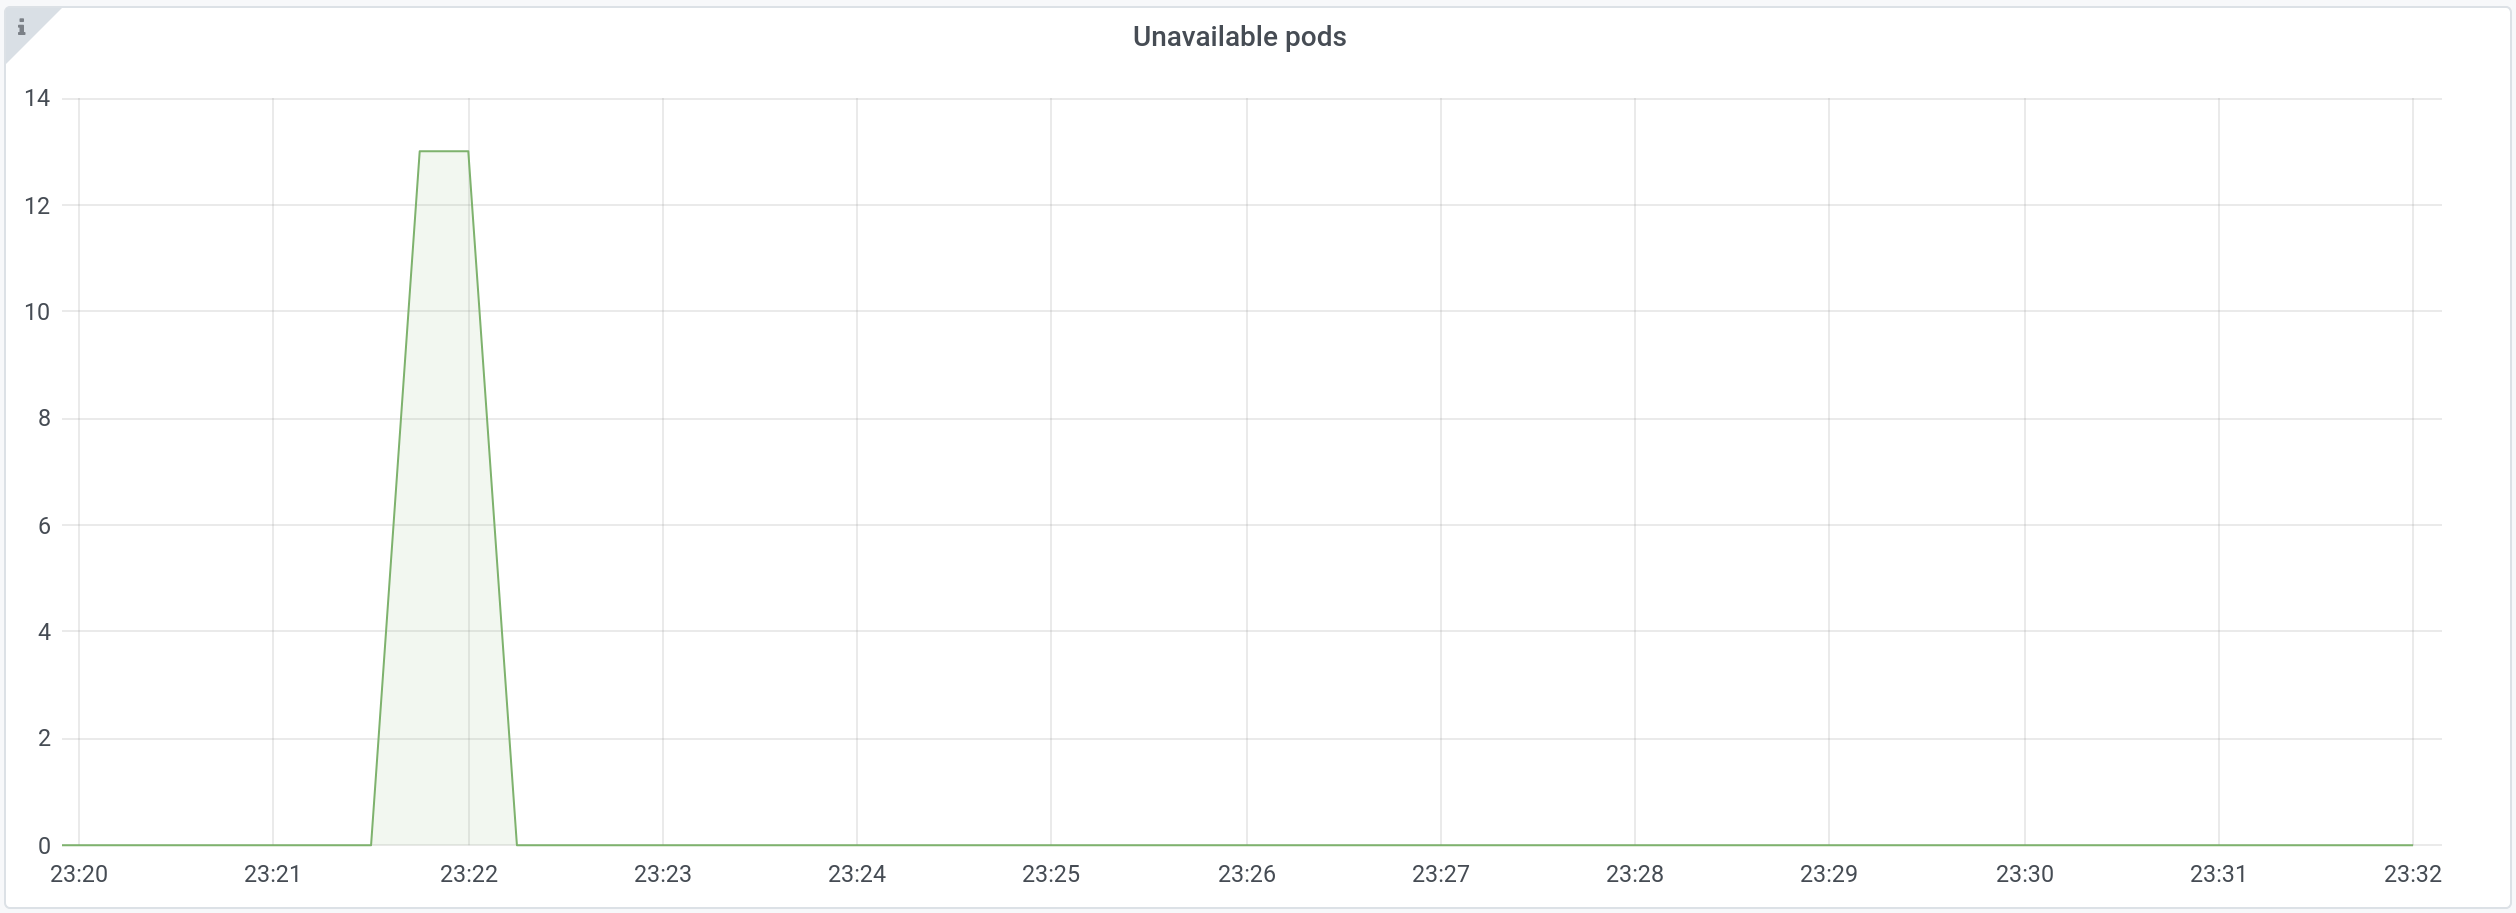 New pods for this application stayed in the Unavailable state for 15 seconds.
Low HPA targets
Kubernetes takes time to scale-up pods.
Without overprovisioning, we’ve measured that we wait up to 4 minutes when there’s no available node where pods can be scheduled.
Then, with overprovisioning, we mostly wait for 45seconds, between the moment the HorizontalPodAutoscaler changes the Replicas of a Deployment and for those pods to be ready and receive traffic.
We can’t wait so long during our peaks, so we generally define HPA targets at 60%, 70% or 80% of Requests. That gives us more time to handle the load while new pods are being scheduled.
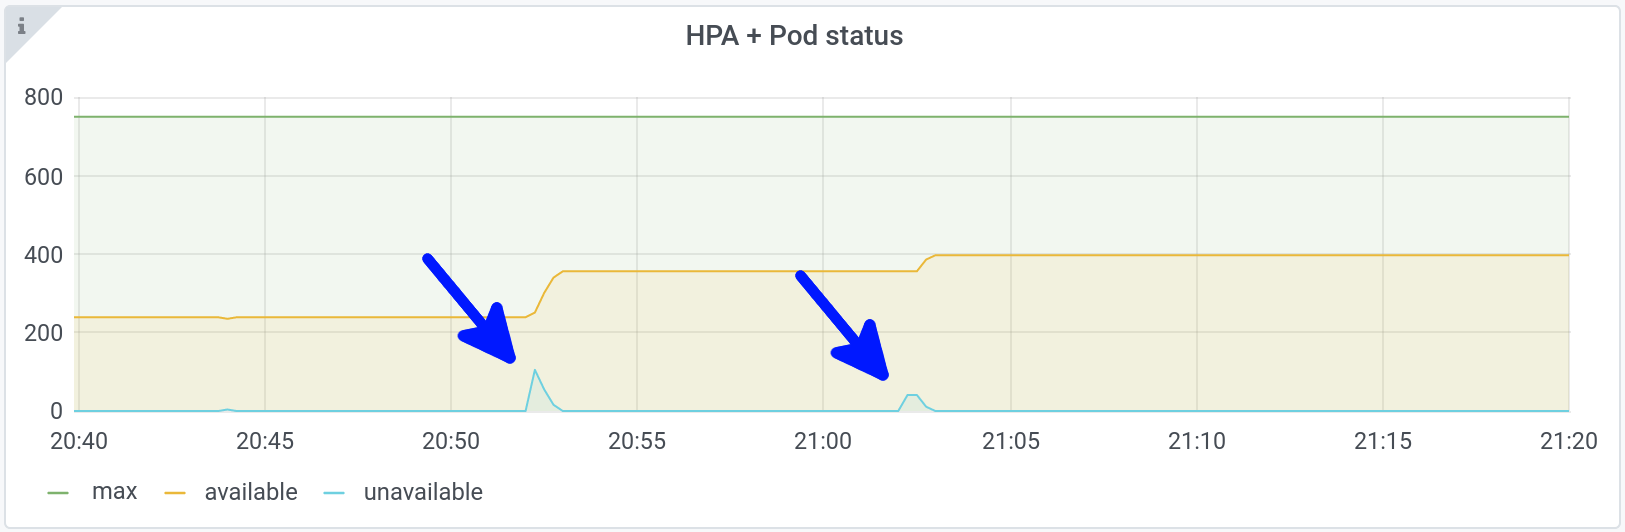
On the following graphs, we can see two nice peaks at 20h52 and 21h02:
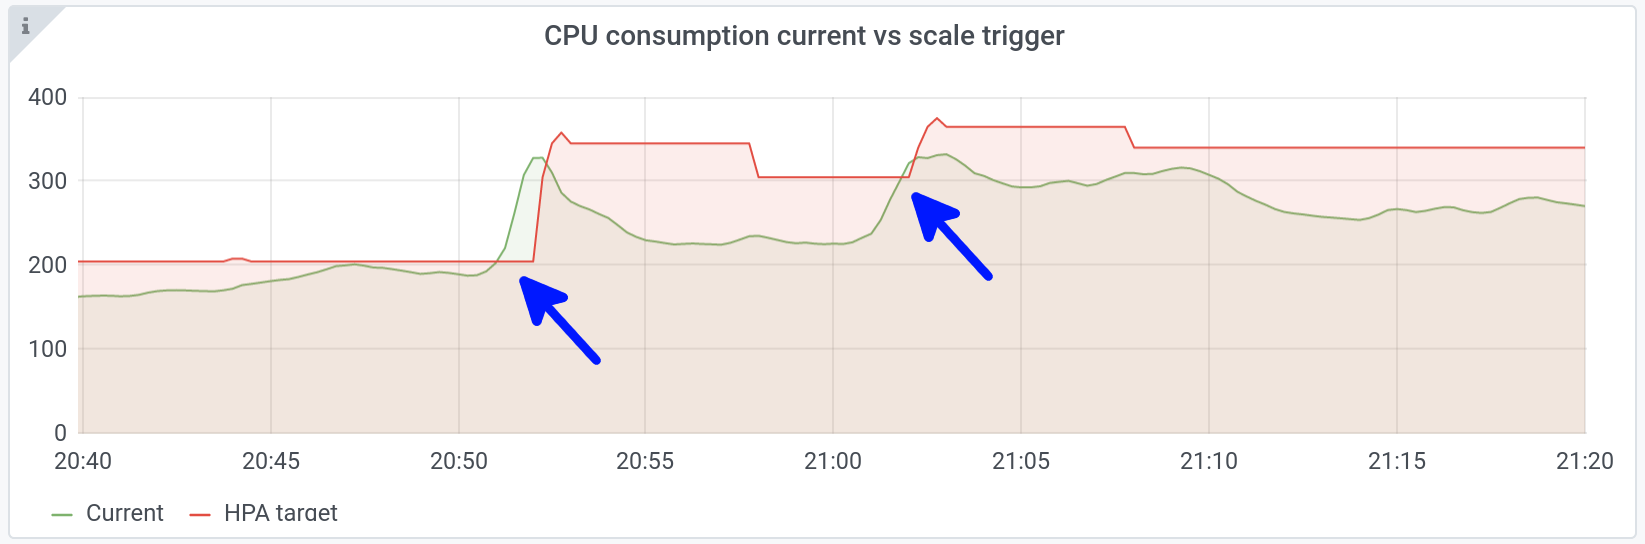 Above, in green, the number of consumed CPUs for one specific application: +55% in one minute.
Below, in blue, new pods are created in response to the peak.
This is obviously not a good way of managing resources, as we waste them as soon as the load balances.
This waste effect is amplified with the load: the more pods we have, the more we waste.
You can see it in this graph that shows the number of CPU reserved but not consumed:
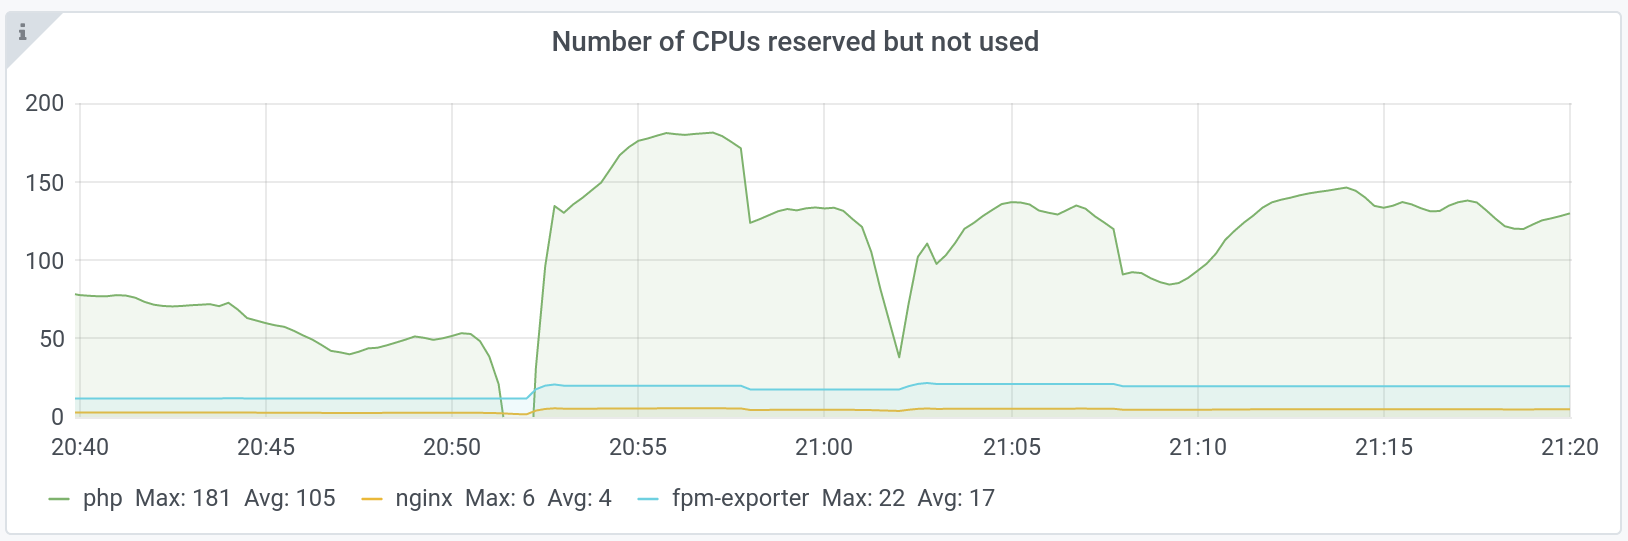
We consume more CPU during peaks and therefore, we use more efficiently the reservations that do not have time to move, because we do not yet have scale-up.
As soon as the new pods added in response to the peak are Ready, 40% of CPU are wasted again.
We don’t have a viable solution to solve this.
We’re thinking about reducing scale-up duration to 10 seconds, so we won’t need these additional resources while we launch new pods. This is a challenge as the scaling mechanism is composed of several tools (metrics-server update frequency, autoscaler controller loop frequency, pod autoscaler initial readiness delay, probe launch times, etc.) and changing only one of them can have catastrophic behavior on the cluster stability. This huge subject will need its own dedicated blogpost…
Long downscale durations
Recently, we have increased the HPA’s downscale durations from 5 to 30 minutes.
It’s done through Kops spec:
  kubeControllerManager:
    horizontalPodAutoscalerDownscaleStabilization: 30m0s
When an application fails, its traffic decreases. When front A fails, traffic on backend B decreases too. When front A comes back, both A and B will have a big peak load.
The default five minutes delay for scaling down pods is too short for us. Increasing this delay makes the return to life of front A transparent on the number of pods of the whole platform, at least for the first 30 minutes of shutdown.
We’ve seen blog posts where people turn off autoscaling for those very situations.
Failure is not an extreme case. Failure is expected. Autoscaling strategies must adapt to it.
You can see that one waits 30 minutes after an upscale, before downscaling:
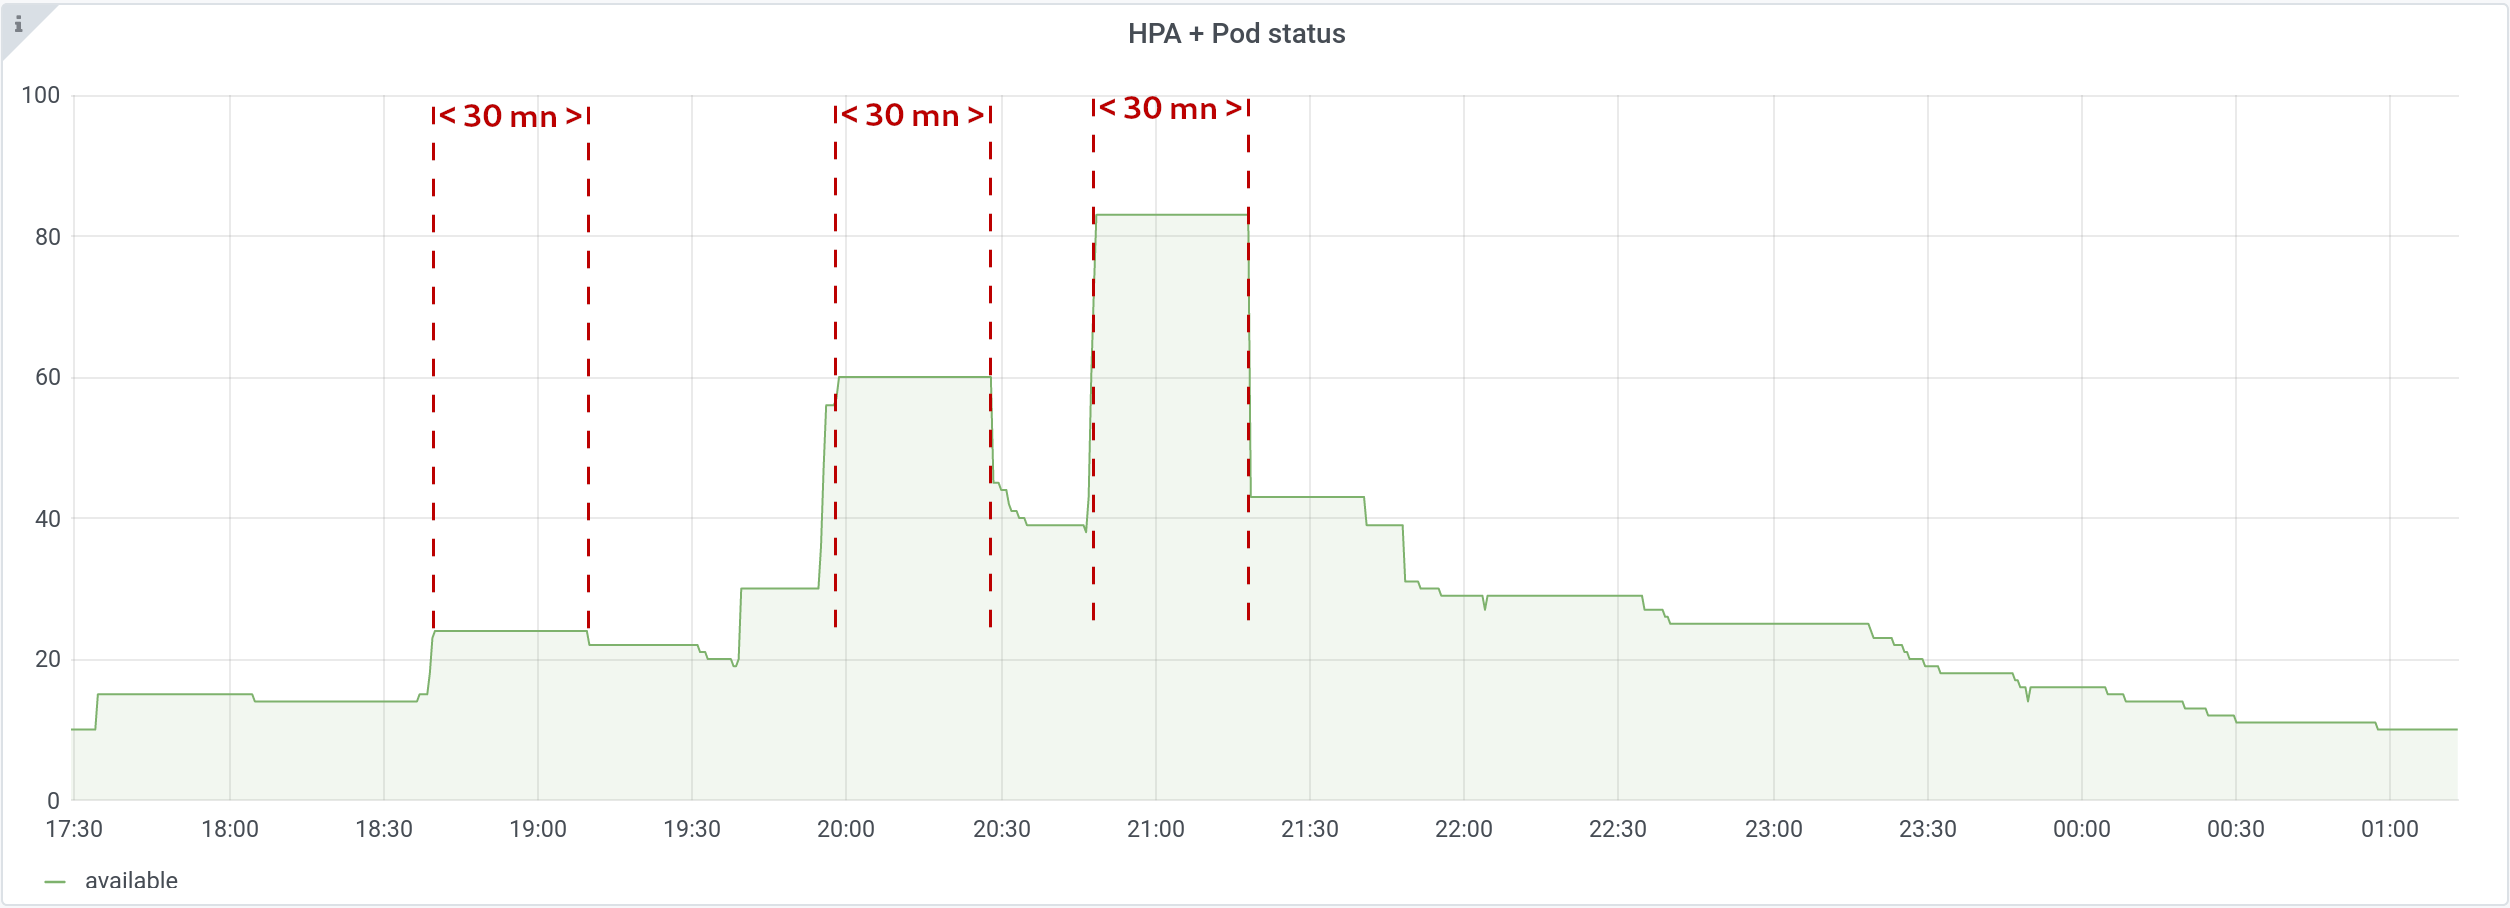
Documentation specifies that: “this duration specifies how long the autoscaler has to wait before another downscale operation can be performed after the current one has completed.”
We can observe on the graph above that it’s rather: “this duration specifies how long the autoscaler has to wait to perform a downscale after the last upscale”.
Observability
Metrics
We scrape application and system metrics via Prometheus.
We’re using Victoria Metrics as long term storage. We found it really easy to deploy and it needs really few time to administer on a daily basis, unlike Prometheus.
Details:
- Prometheus scrapes metrics of pods having:
annotations:
  prometheus.io/path: /metrics
  prometheus.io/port: "8080"
  prometheus.io/scrape: "true"
- Then, inside prometheus jsonnet files, we define a remoteWrite pointing to VictoriaMetrics:
remote_write:
- url: https://victoria-metrics-cluster-vminsert.monitoring.svc.cluster.local.:8480/insert/001/prometheus
  remote_timeout: 30s
  write_relabel_configs:
  - separator: ;
    regex: prometheus_replica
    replacement: $1
    action: labeldrop
  queue_config:
    capacity: 50000
    max_shards: 30
    min_shards: 1
    max_samples_per_send: 10000
    batch_send_deadline: 5s
    min_backoff: 30ms
    max_backoff: 100ms
…
We have 2 Prometheus pods per cluster, each on separate nodes.
Each Prometheus scrapes all metrics in the cluster, for resilience.
They have a really low retention (few hours, because of the WAL replay issue) and are deployed on Spot instances.
We have 2 Victoria Metrics pods per cluster (cluster version), each on separate nodes, separated of Prometheus pods through a podAntiAffinity
affinity:
  podAntiAffinity:
    preferredDuringSchedulingIgnoredDuringExecution:
    - weight: 100
      podAffinityTerm:
        labelSelector:
          matchExpressions:
          - key: app
            operator: In
            values:
            - prometheus
        topologyKey: "kubernetes.io/hostname"
Each Victoria Metrics pod receives all metrics in duplicate, from the two prometheus pods.
We use the command-line flag dedup.minScrapeInterval: 15s to deduplicate metrics.
We’re thinking about totally removing Prometheus from the mix, using only Victoria Metrics Agent to scrape metrics.
Logs
We collect stderr and stdout of all our containers.
We use fluentd for that, as a DaemonSet, which uses the node’s /var/log/containers directory.
We use Grafana Loki as an interface to filter those logs.
Our developers catch most of their logs and send them directly to Elasticsearch. Fluentd and Loki are used only for uncatched errors and have little traffic.
Fluentd uses around 200MB of memory per node and so we look at replacing it by promtail which uses only 40MB in our case.
 We’re happy with Loki, because we have few logs to parse. We’ve tested to get our Ingress Controller access logs sent to Loki and it was a nightmare. Too many entries to parse.
There’s a default limit of 1000 log entries when querying, which we raised but then Grafana became very slow. Very very slow. 3000 log entries is the best fit for us.
Alerting
We mostly use alerts defined in the official prometheus-operator repo.
We also added some alerts of our own. E.g: an alert when our Ingress Controller can’t connect to a pod:
- labels:
    severity: critical
    cluster_name: "{ { $externalLabels.cluster_name } }"
  annotations:
    alertmessage: '{ { $labels.proxy } } : { { printf "%.2f" $value } } requests in error per second'
    description: 'HAProxy pods cannot send requests to this application. Connection errors may happen when one or more pods are failing or there''s no more healthy pods : Application is crashed !!'
    summary: "{ { $externalLabels.cluster_name } } - Critical - K8S - HAProxy IC - Backend connection errors"
  alert: Critical -K8S - HAProxy IC - Backend connection errors
  expr: |
    sum(rate(haproxy_backend_connection_errors_total[1m])) by (proxy) > 0
  for: 1m
Prometheus generates alerts that it sends to 2 redundant AlertManager instances, in a separate account that centralises alerts from all our clusters.
We have several possibilities then:
- Send alerts on Slack dedicated channels
- Send alerts to PagerDuty for the on-call teams
Our developers are managing their own alerts (Kubernetes CRD: PrometheusRule) that are following a different path regarding labels defined. They have their own alerts sent in their own channels.
Costs
Spot instances
We’re running 100% of our application workloads on Spot instances.
It was easy at first: implement spot-termination-handler and voilà.
Indeed, but that was only the first step.
Inter accounts reclaims
We created AWS accounts for salto.fr platform, for which we did a lot of load tests with on-demand servers.
That’s when we reclaimed our own instances on our other accounts.
Your accounts are not “linked” to each other in terms of Spot reclaims. Having resources in the same region with different accounts creates a relationship itself that we had never though about.
In this case, launching on-demand instances on one account triggered reclaims on our other accounts in the same region.
On-demand fallback
We didn’t have on-demand fallback for a year and it went well.
There was enough spot capacity and there was no need for fallback. Therefore, we didn’t prioritize automated on-demand fallbacks.
Then, all our instance types (+10) went InsufficientInstanceCapacity at the same time.
We could only work around with a manual ASG we have from our first days on Kubernetes at AWS, on which we could launch on-demand instances as a last-resort fallback.
Now, we’re using cluster-autoscaler with the expander: priority to automatically fallback on lower priority ASGs (see above Scalability/Cluster-autoscaler).
It takes us around 10mn to start a node when all our instances are InsufficientInstanceCapacity.
There are other mechanisms that directly detect InsufficientInstanceCapacity on an ASG, so we wouldn’t have to wait 5mn before moving on to the next one. We’re thinking about implementing them, but they’re not really compatible with cluster-autoscaler right now.
As of today, we have two ASGs per application group, as Spot, and also two ASGs as on-demand automatic fallback.
Draino and node-problem-detector
The problem came when downscaling : cluster-autoscaler removes the least used node, no matter if it’s a Spot or an on-demand instance.
We found ourselves with a lot of on-demand nodes after load peaks and they stayed on. And they cost a lot more than Spot instances.
We were already using node-problem-detector, so we added draino, to detect if an instance is on-demand and try to remove it when it is. Draino waits for 2h after the node is launched before trying to remove it.
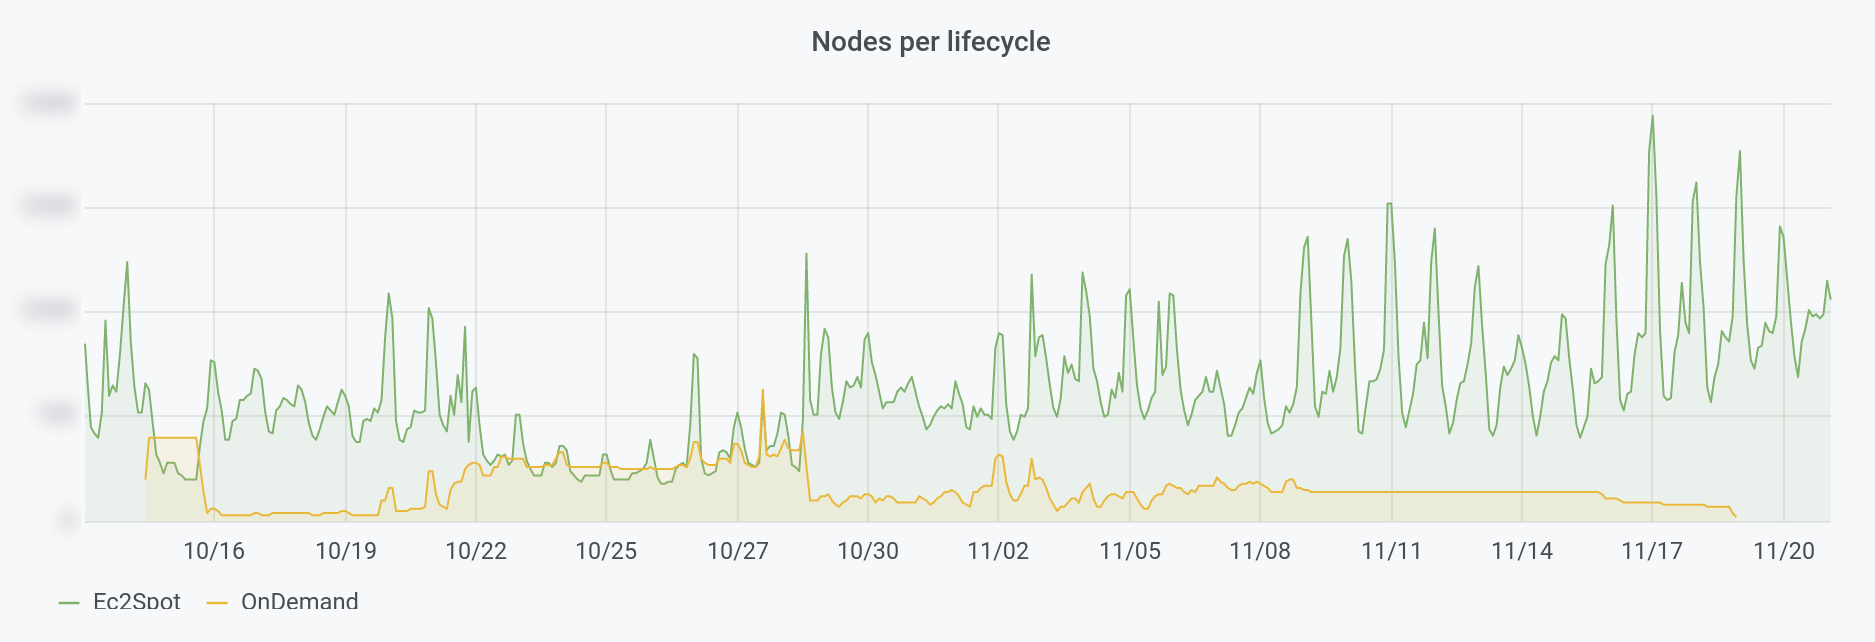
Since then, we use on-demand only when there’s no Spot left and only for a few hours.
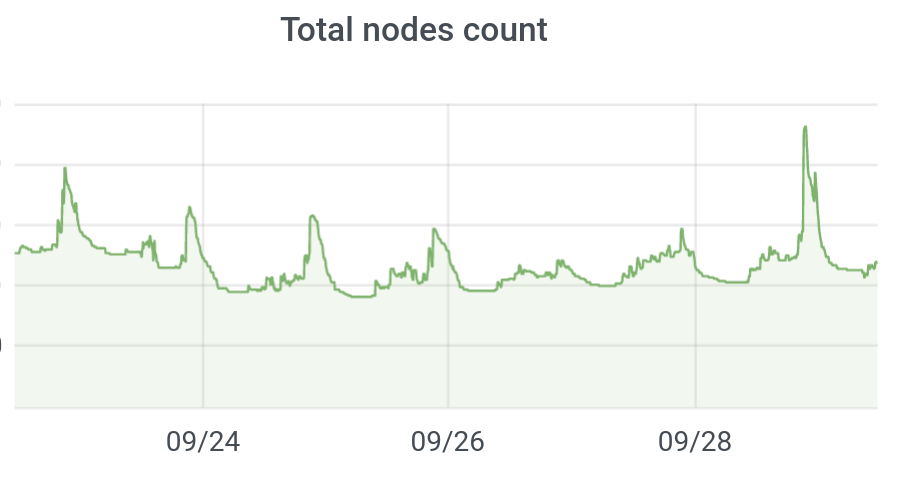
We can see on this graph, that we added automated on-demand fallback and we never stopped having on-demand instances, until we added draino:
Spot Tips
- You need to be in an “old” AWS region to have a large number of Spot available. I.E. consider eu-west-1 instead of eu-west-3, even if it adds latency,
- Use the maximum number of instance types possible. A dozen is barely enough. I.E. use all instance family letters regardless of what they’re optimised for (compute, memory) as long as your workload can use it,
- Use
CapacityOptimizedspot allocation strategy, to limit reclaims to the strict necessary, - Do not use Spot on a single AZ (this advice is not limited to spot),
- Prepare yourself to large reclaims, dozens at a time,
- Configure and test your on-demand fallback
Kube-downscaler
Open-source project from Zalando which allows us to scale down Kubernetes deployments after work hours: nights and week-ends.
We use it on all our staging clusters. We save 60% of EC2 instances.
HAProxy Ingress Controller
The whole traffic of a cluster goes through a single ALB.
We load-balance traffic to the correct pod through HAProxy, which uses Ingress rules to update its configuration.
We explained the way HAProxy Ingress controller lives inside the cluster during a talk at the HAProxy Conf in 2019.
Reducing the number of managed load balancers at AWS isn’t the only benefit of HAProxy: we have tons of metrics in a single Grafana dashboard. Requests number, errors, retries, response times, connect times, bad health checks, etc.
What’s next
A lot has been done to have scalability, resilience, observability and reasoned costs over the last 3 years.
Using Kubernetes in production is not that simple.
It is necessary to be well equipped, to understand finely the workings of the kubernetes mechanics to find the balance that suits us. Avoid falling into the trap of adopting whatever tool everyone is talking about if you don’t need it. There’s a lot of hype around kubernetes and the cloud, it can be dangerous.
The next step will be for us to increase resilience as much as possible, while at the same time reducing costs.
Perhaps it will be by speeding up the start-up of pods. Maybe it won’t work. Maybe we can make some modifications to cluster-autoscaler to make it more compatible with aws events (like InsufficiantInstanceCapacity). But we will certainly work around the costs.
Thanks to all the reviewers, for their good advice and their time ❤️