
What we want
As developers, we (M6Web) want to keep our eyes open on what is going on in production.
Our local CMO (chief monitoring officier ;) ) did a nice presentation about this (in french).
As someone very wise (Theo Schlossnagle) said: “It’s not in production unless it’s monitored”. Another cool mantra is: “I am wondering what to monitor ? everything dude !”. Finally “if you can not measure it, you can not improve it.” (Lord Kelvin).
We ship new apps very often, so we have to industrialise this practice.
What is it?
StatsD is a Node.Js daemon allowing you to send metrics (increment values and timers) over UDP. The fire and forget feature of UDP is great for reducing risks of introducing latency or crashes in your application.
StatsD is open sourced by etsy. In our configuration, we use several StatsD deamons and aggregate metrics on Graphite - one point per minute. Many servers allows us to scale, because we don’t sample the data at all.
On client side, we use a simple consistent hashing algorithm to dispatch metrics overs StatsD nodes on the same server.
Collecting metrics
From raw PHP
We’ve created a simple PHP lib to dispatch metrics over UDP. Check it out on Github or Packagist.
The usage is pretty straightforward :
<?php
// client creation
$client = new Statsd\Client(
                    array(
                        'serv1' => array('address' => 'udp://200.22.143.12'),
                        'serv2' => array('port' => 8125, 'address' => 'udp://200.22.143.12')
                    )
                );
// usage
$client->increment('a.graphite.node');
$client->timing('another.graphite.node', (float) $timing);
From Symfony2
As basic Symfony2 fanboys, we’ve built a bundle on top of the StatsD component. It provides these features:
- manage multiple Symfony services with different configurations
- bind any event to increment nodes and collect timers
During Symfony 2 execution, metrics are collected and sent only at the kernel shutdown. A nice feature is that you can easily collect basic metrics based on events without touching your code.
For example, in conjunction with the M6Web\HttpKernelBundle, just dropping this in config.yml is enough:
m6_statsd:
    clients:
        default:
            servers: ['all']
            events:
              m6.terminate:
                increment:     request.yourapp.<status_code>.<route_name>
                timing:        request.yourapp.<status_code>.<route_name>
                custom_timing: { node: memory.yourapp.<status_code>.<route_name>, method: getMemory }
              m6kernel.exception:
                increment: errors.<status_code>.yourapp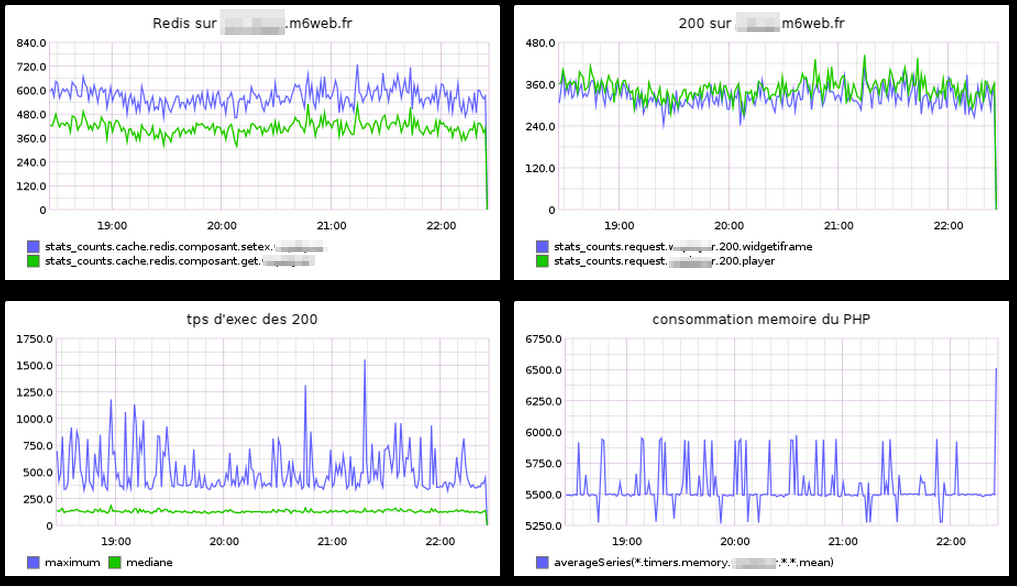
Offering this to the tech team means that I am now pretty sure that almost all new PHP apps pop with those metrics out of the box.
Please checkout the bundle documentation on github.
From anywhere else
From Flex, mobile app or JS applications we’ve developed a simple Node.js app, translating an HTTP call to a StatsD UDP one. Like the PHP implementation, this application shards the metrics over multiple servers.
Please consider sending metrics asynchronously and add a timeout to this HTTP call.
Living with metrics
About 120K metrics are collected on our platform. That’s a lot.
Graphite dashboards are quite rustic. But surprisingly lots of non-techs people use this tool: SEO experts, advertising managers, contributors, …
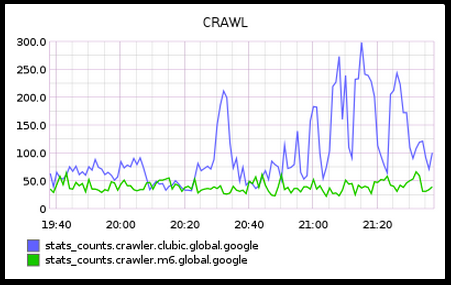
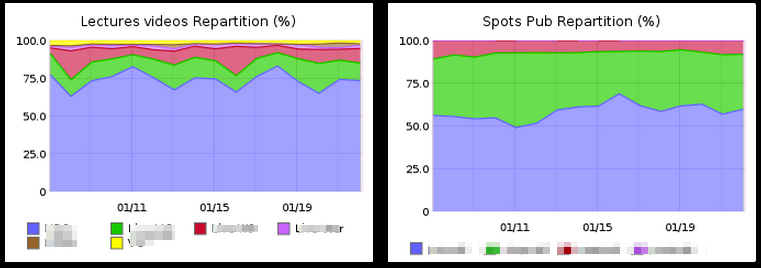
For now we keep using Graphite. We try to keep our dashboards organised and well named.
For alerting purpose, a tool based on Graphite JSON output has been developed. It sends emails when it reaches some user defined conditions. Honestly, it does the job, but frankly we are still looking for something else, more flexible with more notification systems than emails.
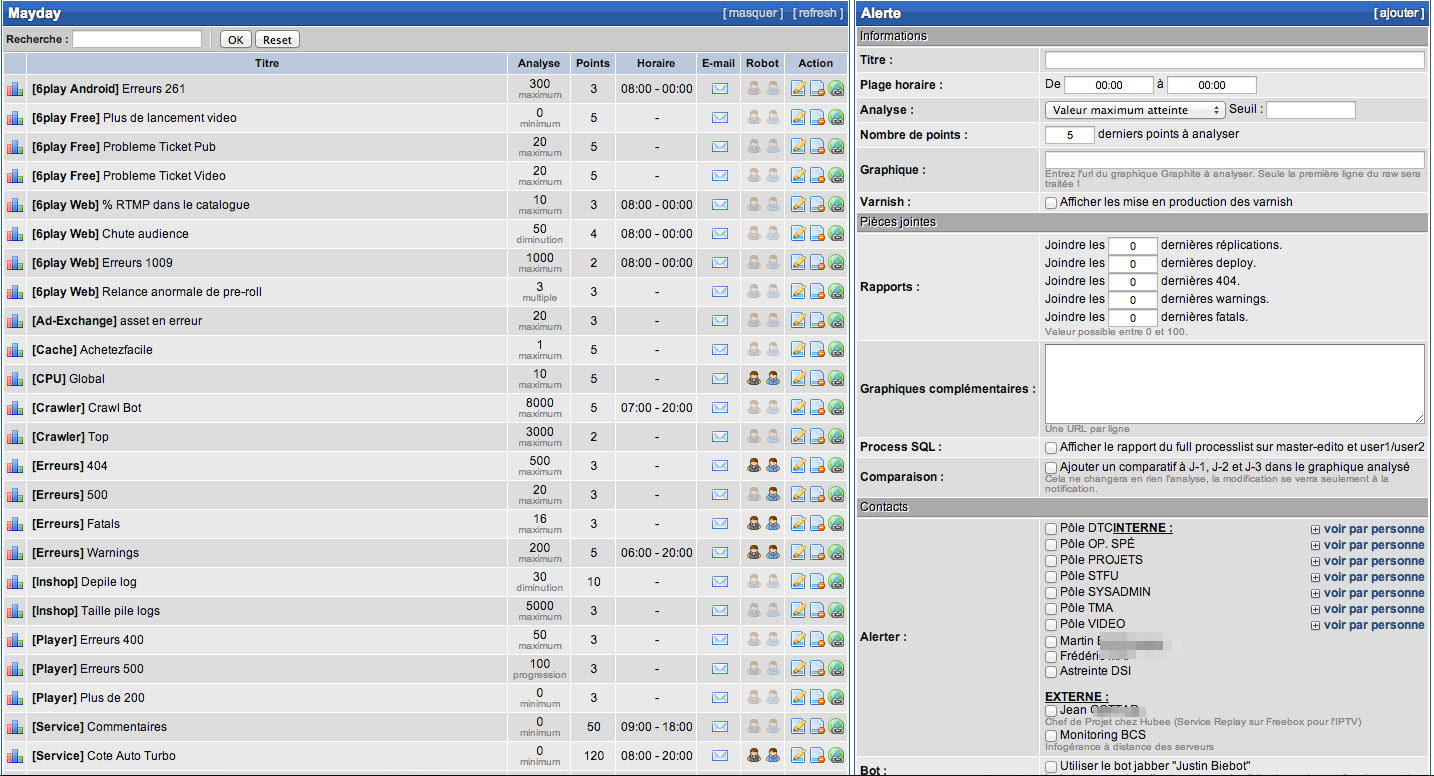
If you use such a tool, and you’re happy with it, please let us know in the comments.
Found a typo or bad english langage, just propose a pull request.